noindex,follow Skip to content
  • Chromatography Solutions
    By Application By System By Service
    Peptides Oligonucleotides mAbs & Antibody Variants Antibody-drug Conjugates Recombinant Proteins Viral Vectors (AAV) Small Molecules & Nutraceuticals Impurity Isolation
    Contichrom® CUBE
    CUBE 30 (36 mL/min) CUBE 100 (100 mL/min) CUBE Software CUBE Accessories
    Contichrom® PILOT
    PILOT 300X (300 mL/min)
    Contichrom® TWIN HPLC
    TWIN 300 (3.3 L/min) TWIN 500 (8.3 L/min) TWIN 1000 (18.9 L/min) TWIN 2000 (36 L/min)
    Contichrom® TWIN LPLC - Capture
    TWIN 300 (3.3 L/min) TWIN 500 (8.3 L/min) TWIN 1000 (18.9 L/min) TWIN 2000 (36 L/min)
    Contichrom® TWIN LPLC - Polishing
    TWIN 300 (3.3 L/min) TWIN 500 (8.3 L/min) TWIN 1000 (18.9 L/min) TWIN 2000 (36 L/min)
    Demos & Introductions Training & Consulting System Rentals Process Modeling Feasibility Studies Custom Purification Maintenance & Repair
    By Application
    Peptides Oligonucleotides mAbs & Antibody Variants Antibody-drug Conjugates Recombinant Proteins Viral Vectors (AAV) Small Molecules & Nutraceuticals Impurity Isolation
    By System
    Contichrom® CUBE
    CUBE 30 (36 mL/min) CUBE 100 (100 mL/min) CUBE Software CUBE Accessories
    Contichrom® PILOT
    PILOT 300X (300 mL/min)
    Contichrom® TWIN HPLC
    TWIN 300 (3.3 L/min) TWIN 500 (8.3 L/min) TWIN 1000 (18.9 L/min) TWIN 2000 (36 L/min)
    Contichrom® TWIN LPLC - Capture
    TWIN 300 (3.3 L/min) TWIN 500 (8.3 L/min) TWIN 1000 (18.9 L/min) TWIN 2000 (36 L/min)
    Contichrom® TWIN LPLC - Polishing
    TWIN 300 (3.3 L/min) TWIN 500 (8.3 L/min) TWIN 1000 (18.9 L/min) TWIN 2000 (36 L/min)
    By Service
    Demos & Introductions Training & Consulting System Rentals Process Modeling Feasibility Studies Custom Purification Maintenance & Repair
  • Learning Center
    Technologies Resource Library Research Highlights Educational Articles
    Batch Chromatography Multi-Dimensional Chromatography (2D/3D) Continuous Capture (CaptureSMB®) Continuous Polishing (MCSGP) Continuous Enrichment (N-Rich®) Dynamic Process Control (AutoPeak® & AutomAb®)
    Application Notes Webinars & Videos Process Guides & Manuals Peer-Reviewed Publications Brochures & Datasheets White Papers
    Peptide Purification Oligonucleotide Purification
    Fundamentals of Preparative Chromatography Troubleshooting & Best Practices (Coming Soon)
    Technologies
    Batch Chromatography Multi-Dimensional Chromatography (2D/3D) Continuous Capture (CaptureSMB®) Continuous Polishing (MCSGP) Continuous Enrichment (N-Rich®) Dynamic Process Control (AutoPeak® & AutomAb®)
    Resource Library
    Application Notes Webinars & Videos Process Guides & Manuals Peer-Reviewed Publications Brochures & Datasheets White Papers
    Research Highlights
    Peptide Purification Oligonucleotide Purification
    Educational Articles
    Fundamentals of Preparative Chromatography Troubleshooting & Best Practices (Coming Soon)
    • About ChromaCon
    • News & Events
    • Distributors
    • Join our team
    • Contact
  • English
  • Deutsch
Get in Touch

Article Category: Peptide Purification

MCSGP Process Validation: Characterization and PPQ at Commercial Scale

Continuous chromatography is already in production use, but there was no published account of how to validate it for a regulatory filing. This study provides one, working through Process Characterization and Performance Qualification for MCSGP on commercial-scale Bivalirudin purification: 34 parameters assessed, four tested, one critical.

Peptide Purification 26 Aug 2026

In this article

  • 1. Why This Study Matters
  • 2. The Study at a Glance
  • 3. How Far the Parameters Were Pushed
  • 4. What Characterization Found
  • 5. Supervising a Multiday Run
  • 6. The PPQ Campaign
  • 7. What It Means at Scale
  • 8. Key Terms
  • 9. FAQs

Research Highlight

A Validation Pathway for Continuous Peptide Chromatography

Continuous chromatography is already in production use for synthetic peptides and oligonucleotides. What has been missing is a published account of how to validate it for a regulatory filing. This study provides one, and carries it through four qualification runs at commercial scale.

Process Characterization and Performance Qualification of MCSGP

Ralf Eisenhuth and Thomas Müller-Späth

Processes 2025, 13(12), 3950 · Published 6 December 2025
Special Issue: New Frontiers in Chromatographic Separation Technology
DOI: 10.3390/pr13123950 · Open access, CC BY

Read the full article Download PDF

Competing interests, as disclosed by the authors: Ralf Eisenhuth was employed by Bachem AG and Thomas Müller-Späth by YMC ChromaCon. The research received no external funding.

Citation (BibTeX)
@article{eisenhuth2025process,
  title   = {Process Characterization and Performance Qualification of MCSGP},
  author  = {Eisenhuth, Ralf and M{\"u}ller-Sp{\"a}th, Thomas},
  journal = {Processes},
  volume  = {13},
  number  = {12},
  pages   = {3950},
  year    = {2025},
  doi     = {10.3390/pr13123950}
}
  • 1. Why This Study Matters
  • 2. The Study at a Glance
  • 3. How Far the Parameters Were Pushed
  • 4. What Characterization Found
  • 5. Supervising a Multiday Run
  • 6. The PPQ Campaign
  • 7. What It Means at Scale
  • 8. Key Terms
  • 9. FAQs

MCSGP purifies continuously, recycling impure side fractions between two columns so that high yield and high purity are reached together. It does that by running to predefined recycling and collection windows, cycle after cycle, for hours or days — without the mid-run adjustment to pooling boundaries that an operator can make in batch chromatography. The chromatographic separation therefore has a greater influence on final product quality, and correspondingly more weight falls on the control strategy around it.

That makes validation a more demanding exercise. How do you show, in a regulatory filing, that a process running to fixed windows for days will deliver the right material every cycle?

This study is the first published Process Characterization and Process Performance Qualification approach for MCSGP, worked through on a commercial peptide. It identifies which process parameters actually matter, defines a supervision strategy for runs that last days, and confirms both across four qualification runs at manufacturing scale.

The study is a collaboration between Bachem AG and YMC ChromaCon, with Bivalirudin as the test system. It sits alongside an earlier characterization and validation study for CaptureSMB, the simpler twin-column capture process, and extends that thinking to gradient purification.

1. Why This Study Matters: A Gap Between Practice and Paperwork

MCSGP is in operation at several companies and research institutes, purifying synthetic peptides and oligonucleotides at production scale. Its appeal is well documented: internal recycling of impure side fractions lets it reach high yield and high purity at the same time, with a high degree of automation, fewer in-process controls and a lower process mass intensity than batch chromatography.

Regulatory validation is a separate matter from process performance, and it has its own structure. The FDA Process Validation guideline sets out three elements:

  • Process Design Builds scientific understanding of the process. Process Characterization is the central piece: identifying which parameters could affect critical quality attributes, testing the high-ranked ones experimentally, and defining the ranges within which quality is met.
  • Process Performance Qualification Confirms that the equipment and process perform as intended and can manufacture reproducibly at commercial scale. At least three consecutive representative batches are run under normal operating conditions, in the actual facility, with trained operators and qualified equipment.
  • Continued Process Verification Ongoing monitoring once routine manufacturing is under way. This study covers the first two elements; the third is outside its scope.

None of that framework is specific to continuous chromatography, and the paper’s finding is that it largely does not need to be. What was missing was a worked example showing how it applies to a process whose defining feature — recycling material between two columns — has no counterpart in batch operation.

Where MCSGP differs, and where it does not

The paper separates the purification into two parts: the chromatographic part, which is identical for batch and MCSGP, and the product collection and recycling part, which is specific to MCSGP. The list of process parameters is therefore largely the same as for a batch process, with a few additions covering the recycling and collection step.

The practical difference is how many elutions it takes to generate meaningful data. For a batch purification, one elution per tested parameter is considered sufficient. An MCSGP experiment needs at least three cycles with two elutions each — enough to confirm that the process has reached cyclic steady state, that impurities are not accumulating through the weak or strong recycling streams, and that changes in column load caused by internal recycling do not affect the outcome.

2. The Study at a Glance

Bivalirudin was used as the test system: a 20-amino-acid direct thrombin inhibitor with a molecular weight of 2,180 g/mol, produced by solid-phase peptide synthesis and supplied as crude material of 81% purity. The target for the product pool was more than 99.0% purity, with the added constraint that the impurity profile had to be comparable to the legacy batch process.

1 of 34

Process parameters classified as critical after characterization

62%

Gross-to-gross yield across the campaign, against 57% for the legacy batch process

3.2

In-process controls per kg of product, down from 81

1,400

kg/kg process mass intensity for the purification stage, down from around 5,200

What was run, and on what

Process Characterization

Carried out on a Contichrom CUBE 30 system. Four potentially critical parameters were varied one at a time, with at least five MCSGP cycles at each set point to confirm cyclic steady state. The two elutions per cycle were pooled and analyzed by HPLC for purity, individual impurities and yield.

Process Performance Qualification

Carried out on a Contichrom TWIN 500 system with two 30 cm internal diameter dynamic axial compression columns. A pre-PPQ GMP run of eleven elutions was followed by a campaign of four multiday MCSGP runs. All runs used AutoPeak UV-based process control, with detection at 280 nm.

3. How Far the Parameters Were Pushed

Most of the 34 identified parameters were never tested experimentally, and the reasoning behind that is worth following. Large-scale MCSGP equipment holds most parameters within narrow limits by construction. A Contichrom TWIN system has four three-head pumps — two for gradient generation, one for feeding, one for in-line dilution, cleaning-in-place and equilibration — and each is controlled by a dedicated flow meter with a calibration tolerance of ±2%.

Whether that ±2% matters depends entirely on what the pump is doing. For equilibration, in-line dilution, cleaning-in-place and chase washes, a 2% variation is negligible. For column load it is not: a 2% change alters the peak shape, which can shift what ends up inside the recycling zones. So the same tolerance makes one parameter well-controlled and another potentially critical, and only the second needs an experiment.

That assessment left four parameters to test. Each was then varied well beyond the range it covers in production.

normal → tested set point Linear velocity ±2% → ±10% Displacer slope ±8% → ±25% Column load ±2% → ±10% Detection wavelength ±1.6 nm → ±5 nm Normal variation — the spread the pumps, eluent preparation and detector actually produce. Tested range — each parameter stressed at least three times wider than it varies in practice. CPP Purity held inside ±3σ for all four. Only the shallow slope shifted the impurity profile, so gradient slope alone became a critical process parameter.
  • Linear velocity
  • Displacer slope
  • Column load
  • Detection wavelength

What the equipment actually does. Each flow meter on the TWIN pumps carries a ±2% calibration tolerance, and eluent preparation adds to the spread on the gradient slope. These are the ranges routine manufacturing has to live with.

Linear velocity
±2%
Displacer slope
±8%
Column load
±2%
Detection λ
±1.6 nm

Ranges as reported in Table 4 of the study. Each row is drawn to its own tested range, so the inner bar shows how much of that range normal operation occupies rather than a shared scale. Colors identify the parameter, following Figure 3 of the paper; they do not indicate good or bad.

A Simple Analogy

Testing a bridge does not mean driving the expected traffic across it. It means loading it far past anything it will carry in service, and watching for the first sign of movement.

That is what the tested ranges are for. A gradient slope that varies by ±8% in production was pushed to ±25%; a column load that varies by ±2% was pushed to ±10%. If quality holds across a range several times wider than reality, the margin between normal operation and any observable effect is large — and that margin is what a control strategy is built on.

4. What Process Characterization Found

Every set point produced product above the 99.0% purity specification. Across all the characterization runs the average pool purity was 99.30%, and every individual value fell inside a band of ±3 standard deviations, that is 99.30% ± 0.32%. Since ±3σ captures roughly 99.7% of expected values for a normal distribution, the effect of the parameter variations was statistically indistinguishable from ordinary process noise. On purity alone, all four parameters would have been classified as non-critical, and the proven acceptable range would have been the full characterized range.

Purity did not identify the critical parameter. The impurity profile did.

Each eluate pool was also examined for individual impurities. Those profiles were consistent across every run but one: at −25% displacer slope, a single impurity rose from below the limit of quantitation to 0.13%. Small in absolute terms, but the specification required the impurity profile to be comparable to the legacy process, and it no longer was.

On that basis gradient slope was designated a critical process parameter, and the variance permitted during routine manufacturing was reduced through organizational measures. Column load, elution flow rate and detection wavelength were designated non-critical. The gross-to-gross yields were also evaluated; excluding the shallow-slope run, they fell between 60% and 65%.

Why one factor at a time, rather than a designed experiment

The choice of OFAT over DoE is argued explicitly, and the reasoning is specific to peptides. Related substances in a peptide tend to behave as regular samples, with similar retention behavior under gradient conditions, so the primary observable effect of parameter variation is the width of the overall peak rather than a change in resolution. Purity changes in MCSGP then tend to come from misalignment between the peak and the fixed recycling and collection zones.

That creates a practical hazard for a designed experiment. Combinations that cumulatively broaden or narrow the peak — a lower column load with a steeper slope and a wavelength shift that lowers the signal, for instance — can push the peak far enough out of alignment with fixed zones to fail the run, forcing repeated iterations of the DoE setup. OFAT does not reveal interactions between parameters, which is a real limitation, but it allows much wider ranges to be tested. For molecules with stringent purity specifications the paper recommends including the combinations that produce the narrowest and broadest peaks as fixed experiments, and considering smaller ranges.

5. Supervising a Process That Runs for Days

An MCSGP process producing eluate continuously for several days presents a sampling problem that batch chromatography does not. Collecting and analyzing every main cut separately is not cost-effective at production scale, but sampling too little leaves the process unsupervised. The answer here is a two-phase strategy.

  • Start-up: intensive monitoring Every main cut is analyzed by an in-process control method until three criteria for cyclic steady state are met — comparable impurity profiles for the main cuts, good overlay of the UV traces on each column, and comparable main cut volume on a column basis.
  • Steady state: strategic sampling Once those criteria are satisfied, HPLC sampling drops to two samples per day. Supervision then rests on three elements together: the strategic samples, the online UV trace overlay, and the recorded main cut volume per column.

The approach is aligned with the risk management expectations for product availability set out in ICH Q9 (R1).

AutoPeak as Process Analytical Technology

Underpinning the strategy is AutoPeak, which monitors UV at the column outlets and starts and stops the recycling and collection phases from absolute and relative UV triggers rather than from the clock. The main cut borders are set as UV thresholds entered into the control. Because the cut points track the peak rather than elapsed time, retention time shifts that accumulate over a long run do not move the pool composition.

The qualification runs illustrate this. Over PPQ batch 1, a slight peak shift appeared from cycle to cycle; when the traces were realigned to the AutoPeak trigger point marking the start of product collection, they overlaid exactly. On that basis the paper positions AutoPeak as Process Analytical Technology in the sense of the FDA PAT guidance — a framing supported by the FDA Process Validation and PAT guidance documents and by ICH Q8, Q11 and Q13, which explicitly support real-time monitoring as part of a control strategy.

6. The PPQ Campaign: Full Results

A pre-PPQ GMP run came first: eleven elutions, 1.5 kg of crude purified to 0.8 kg of intermediate at 99.6% purity, with a PMI of 1,402 kg/kg for the purification alone. The qualification campaign then ran four multiday MCSGP runs, the last batch split into two parts, to cover a range of batch sizes.

All four produced consistent elution profiles, main cut sizes and product purities. Comparing the third elution — the first at cyclic steady state — with elution 106 of the longest run showed the impurity profile holding across the full duration, and purity for every full elution stayed within the ±3σ band anticipated from characterization.

  • Crude in 54.5 kg at 81% purity
  • MCSGP 397 elutions over 235 hours, producing 1,576 L of main cut
  • SPE 42 elutions over 65 hours on the same system and columns, alternately loading and eluting with a sharp gradient, producing 631 L of main cut
  • API out 33.6 kg at 99.2% purity — a gross-to-gross yield of 62%, or 76% effective yield taking product and crude purity into account
  • Total 300 hours of chromatography operating time

Against the legacy process

Swipe the table sideways to see the legacy and MCSGP columns.

Metric Legacy batch process MCSGP with AutoPeak
Bivalirudin target purity >99.0% · impurity profile comparable to legacy
Column configuration One 60 cm i.d. column Two 30 cm i.d. columns
Gross-to-gross yield 57% 62%
In-process controls per kg 81 3.2
In-process controls, whole campaign 2,753 108
Process mass intensity, purification stage ~5,200 kg/kg 1,400 kg/kg

Source: Eisenhuth and Müller-Späth, Processes 2025, 13, 3950 (CC BY). The legacy figure is the existing Bivalirudin batch process, which includes extensive side-cut re-chromatography.

Experimental conditions

Test molecule

Bivalirudin, a 20-mer direct thrombin inhibitor, 2,180 g/mol, from crude of 81% purity produced by solid-phase peptide synthesis.

Preparative chemistry

C-18 stationary phase with a TFA / acetonitrile / water solvent system. UV detection at 280 nm.

Characterization system

Contichrom CUBE 30 (YMC ChromaCon, Zurich), with at least five MCSGP cycles per set point.

Qualification system

Contichrom TWIN 500 (YMC America) with 30 cm internal diameter dynamic axial compression columns.

Analytics

Waters CSH C18, 1.7 µm, with a TFA / acetonitrile mobile phase on an Acquity UPLC system.

Process control

AutoPeak UV-based control active on all MCSGP runs, setting recycling and collection phases from absolute and relative UV triggers.

7. What This Means for Peptide Manufacturing

On the evidence here, the regulatory framework does not need reinventing for continuous chromatography. The parameter list is largely the batch list, the risk assessment is the standard one, and the qualification requirement is the standard three-batch expectation. What changes is the number of elutions needed to generate data, and the shift from correcting a process to supervising one.

That is a useful result for anyone weighing continuous purification against the validation work it would imply. Of 34 identified parameters, four warranted experiments and one turned out to be critical — and the paper notes that those same four would also be investigated during characterization of the corresponding batch process. The characterization burden is comparable; the difference is material consumption, since cyclic steady state has to be confirmed from successive identical elution profiles. In this study that extra experimental time was minimized by daisy-chaining the required MCSGP runs and executing them automatically.

The operational advantages appear in the campaign figures rather than in the validation argument. Running uninterrupted over several days, with the control strategy supported by online measurement, produced a substantial reduction in analytical sampling and process mass intensity alongside a higher gross yield. The authors also note that data integrity and electronic batch record handling requirements are identical for batch and MCSGP.

Another crucial topic for commercial manufacturing about “green solvents” for peptide purification is covered in another research highlights article, and the platform view — where MCSGP fits in a peptide workflow — is set out under peptide purification with MCSGP. AutoPeak itself is described in more detail under dynamic process control.

What the study does not claim

  • One molecule, one site. The approach was demonstrated on Bivalirudin at a single manufacturer. The paper states directly that for different peptides or oligonucleotides, other parameters may be identified as potential CPPs. The four tested here are not a general list.
  • The legacy comparison is not a controlled experiment. The 57% yield, 81 IPCs per kg and ~5,200 kg/kg PMI describe the existing batch process for this peptide, which includes extensive side-cut re-chromatography. The paper presents them as reference figures for the legacy process, not as a controlled comparison run alongside the MCSGP campaign.
  • Two of the three validation elements. The study covers Process Characterization and Process Performance Qualification. Continued Process Verification, the ongoing monitoring phase, is outside its scope.
  • Column lifecycle is excluded. The paper omits it deliberately, noting it is usually stand-alone work extending well beyond the manufacture of PPQ batches.
  • Crude lots still need checking individually. The impurity profile has to be assessed case by case for each new crude lot with a small-scale use test until enough upstream batch experience exists to define standard parameters.
  • The authors have a commercial interest. Ralf Eisenhuth was employed by Bachem AG, which manufactures the peptide, and Thomas Müller-Späth by YMC ChromaCon, which commercializes MCSGP. The paper discloses both.

8. Key Terms in This Study (Glossary)

Term Definition
AutoPeak UV-based process control that starts and stops MCSGP recycling and collection phases from absolute and relative UV triggers at the column outlets, rather than from elapsed time.
Critical process parameter (CPP) A process parameter whose variation has a demonstrated impact on a critical quality attribute, and which therefore has to be controlled within defined limits.
Critical quality attribute (CQA) A property of the product that must fall within a defined range to ensure quality. The criteria used in this study were product purity, levels of individual related substances, and yield.
Continued Process Verification (CPV) The third element of FDA Process Validation: ongoing monitoring of the process during routine commercial manufacturing.
Cyclic steady state The condition in a continuous process where each cycle reproduces the previous one. Confirmed here from comparable impurity profiles, overlaid UV traces and consistent main cut volumes.
Design of Experiments (DoE) An experimental strategy that varies several parameters together, revealing interactions between them. Not used here — see OFAT.
Displacer slope The rate at which the eluting solvent strength increases during the gradient. The one parameter classified as critical in this study.
FMEA Failure Mode and Effect Analysis, a structured risk assessment used to rank process parameters by their potential impact on quality attributes.
Gross-to-gross yield Mass of API produced divided by mass of crude loaded, ignoring the purity and peptide content of the crude. Used here for consistency with the legacy process.
In-process control (IPC) An analytical test performed on material during manufacturing to confirm the process is performing as intended.
Main cut The product fraction collected from an elution, with its borders set in this process by UV thresholds entered into AutoPeak.
MCSGP Multicolumn Countercurrent Solvent Gradient Purification: a continuous twin-column gradient chromatography process that recycles impure side fractions internally rather than discarding them.
OFAT One Factor At A Time: varying a single parameter per experiment. Does not reveal interactions, but allows much wider ranges to be tested than a designed experiment.
Process Analytical Technology (PAT) A framework for designing and controlling manufacturing through timely measurement of critical attributes, set out in FDA guidance and supported by ICH Q8, Q11 and Q13.
Process Characterization (PC) The part of Process Design that identifies potential critical process parameters, tests the high-ranked ones experimentally, and defines the ranges within which quality attributes are met.
Process Mass Intensity (PMI) Total mass of material input per unit mass of product. Reported here for the purification stage only.
Process Performance Qualification (PPQ) The second element of Process Validation: demonstrating at commercial scale, in the actual facility, that the process consistently delivers product meeting specification.
Proven Acceptable Range (PAR) The range of a process parameter within which quality attributes are demonstrated to be met. Where a parameter shows no effect, the PAR is the full characterized range.
±3σ band Three standard deviations either side of the mean, capturing roughly 99.7% of expected values for a normal distribution. Used here as the threshold for distinguishing a real effect from process noise.

9. Frequently Asked Questions

Yes, and this study is the first published account of how. It applies the standard FDA Process Validation framework to MCSGP, working through Process Characterization and Process Performance Qualification for the purification of Bivalirudin. The process parameter list turns out to be largely the same as for batch chromatography, with a few additions covering the recycling and collection step, and the qualification requirement is the standard expectation of at least three consecutive representative batches.

In this case, four of 34 identified parameters warranted experimental testing: linear elution velocity, gradient slope, column load, and detection wavelength. Of those, only gradient slope was ultimately classified as a critical process parameter. The paper is explicit that this is molecule-specific — for different peptides or oligonucleotides, other parameters may prove critical.

Because purity was not the attribute that moved. Every run produced pool purity above 99.0%, within a ±3σ band of 99.30% ± 0.32% — statistically indistinguishable from process noise. The individual impurity profiles told a different story: at −25% displacer slope, one impurity rose from below the limit of quantitation to 0.13%. Since the specification required the impurity profile to be comparable to the legacy process, that single change was enough to classify the parameter as critical and tighten its permitted variance.

Fewer, once the process is at cyclic steady state. In this campaign the number of in-process controls fell from 81 per kg for the legacy batch process to 3.2 per kg — 108 tests across the whole campaign against 2,753. The supervision strategy front-loads the sampling: every main cut is analyzed during start-up until steady state criteria are met, after which HPLC sampling drops to two samples per day, backed by online UV trace overlay and main cut volume recording.

Yes. Where one elution per tested parameter is considered sufficient for a batch purification, an MCSGP experiment needs at least three cycles with two elutions each, so that cyclic steady state can be confirmed and impurity accumulation through the recycling streams ruled out. The paper notes this requirement, and that in this study the extra experimental time was minimized by daisy-chaining the required runs and executing them automatically.

The paper positions it as PAT in the sense of the FDA PAT guidance. AutoPeak monitors UV at the column outlets and uses absolute and relative triggers to start and stop the recycling and collection phases, so the cut points follow the peak rather than the clock. The FDA Process Validation and PAT guidance documents, together with ICH Q8, Q11 and Q13, explicitly support PAT and real-time monitoring as part of a control strategy.

Commercial scale. Four multiday MCSGP runs on a Contichrom TWIN 500 system with two 30 cm internal diameter columns processed 54.5 kg of crude Bivalirudin into 33.6 kg of API at 99.2% purity, across 397 MCSGP elutions over 235 hours plus a solid phase extraction step of 42 elutions over 65 hours on the same equipment.

Yes. It is published open access under a CC BY license in Processes (MDPI), so it can be read, downloaded and reused with citation. The full parameter tables, the characterization results and the qualification campaign data are in the article itself.
Acetonitrile- and TFA-Free Peptide Purification with MCSGP

Green solvents have always cost the peptide industry recovery. This study shows the loss is a property of batch chromatography, not of the solvent: run the same green eluent counter-currently and the yield comes back.

Peptide Purification 25 Aug 2026

In this article

  • 1. Why This Study Matters
  • 2. The Study at a Glance
  • 3. Where the Yield Goes
  • 4. The Green Solvent Penalty
  • 5. How MCSGP Closes the Gap
  • 6. Full Results
  • 7. What It Means at Scale
  • 8. Key Terms
  • 9. FAQs

Research Highlight

Green Solvents Without the Yield Penalty

Green solvents such as ethanol and dimethyl carbonate have long been proposed in place of acetonitrile, with acetic acid in place of TFA, but their industrial adoption has been limited by lower yield and productivity in batch operation. A new open-access study shows that the yield gap closes when the same eluents are run in a counter-current twin-column process (MCSGP).

Counter-Current Chromatography Enables Use of Green Solvents for Productive Peptide Purification Processes

Rosella Prestia, Damian Hauri, Mattia Sponchioni, Sebastian Vogg and Thomas Müller-Späth

Separations 2026, 13(7), 195 · Published 4 July 2026
Special Issue: Advanced Separation Media and Technologies for Biomolecules
DOI: 10.3390/separations13070195 · Open access, CC BY

Read the full article Download PDF Supplementary material

Competing interests, as disclosed by the authors: D.H., S.V., T.M.-S. and — for the duration of the work — R.P. are employees of YMC ChromaCon, which commercializes the technology described in the paper. The research received no external funding.

Citation (BibTeX)
@article{prestia2026countercurrent,
  title   = {Counter-Current Chromatography Enables Use of Green Solvents
             for Productive Peptide Purification Processes},
  author  = {Prestia, Rosella and Hauri, Damian and Sponchioni, Mattia
             and Vogg, Sebastian and M{\"u}ller-Sp{\"a}th, Thomas},
  journal = {Separations},
  volume  = {13},
  number  = {7},
  pages   = {195},
  year    = {2026},
  doi     = {10.3390/separations13070195}
}
  • 1. Why This Study Matters
  • 2. The Study at a Glance
  • 3. Where the Yield Goes
  • 4. The Green Solvent Penalty
  • 5. How MCSGP Closes the Gap
  • 6. Full Results
  • 7. What It Means at Scale
  • 8. Key Terms
  • 9. FAQs

Preparative reversed-phase liquid chromatography is one of the most resource-intensive stages of synthetic peptide manufacturing, and production processes commonly rely on acetonitrile (ACN) with trifluoroacetic acid (TFA). That eluent system is chosen mainly for its high chromatographic resolution — and it is exactly the combination that environmental and safety pressure is now working to remove.

Greener alternatives are well characterized. Ethanol is low-toxicity and bio-derived; dimethyl carbonate (DMC) is an emerging bio-based substitute for acetonitrile; acetic acid is a typical candidate for a green counterion in place of TFA. What has blocked their adoption is not chemistry but process economics: in conventional batch chromatography, they lead to decreased resolution and product loss.

The finding: green eluents do not fail on purity, they fail on collection window. Every green batch run in this study met its purity specification. What collapsed was recovery — and the study attributes that to the inability of a batch process to use partially resolved fractions, rather than to insufficient purity.

This highlight summarizes the study, its data, and its limitations, and links to the full open-access article.

1. Why This Study Matters: The Solvent Problem in Peptide Purification

Peptide therapeutics are in a demand surge. More than 80 peptide drugs have received regulatory approval since 2023, with over 200 candidates in clinical development. GLP-1 receptor agonists have become the dominant class in the pharmaceutical market, and the global anti-obesity segment is projected to exceed $100 billion by 2030. That demand has exposed manufacturing bottlenecks in synthesis, purification, and fill-finish.

Purification carries a disproportionate share of the burden. Solid-phase peptide synthesis already runs at a process mass intensity of roughly 3,000–15,000 kg of material per kg of active ingredient for peptides in the 1,000–5,000 Da range. Downstream chromatography then adds several hundred to several thousand liters of eluent per kilogram of purified peptide, of which 10–40% is organic modifier.

Three problems with the standard eluent system

  • TFA is a PFAS Trifluoroacetic acid belongs to the per- and polyfluoroalkyl substances and is highly persistent in the environment — it is a “forever chemical” with potential toxicity risks. Regulatory and environmental pressure on PFAS in pharmaceutical manufacturing is increasing.
  • Acetonitrile is flammable and toxic Replacing the organic modifier is therefore one half of the problem, alongside replacing the acid. Ethanol and dimethyl carbonate are the substitutes tested here.
  • The dilution prevents recycling Because the organic modifier is so heavily diluted, the eluent cannot practically be recycled. The paper links that volume directly to waste generation, environmental impact, and limits on process throughput.

The obstacle to switching has been consistent and well documented: replacing ACN/TFA with green alternatives reduces chromatographic resolution, and reduced resolution in a batch process means lower yield and lower productivity. Until now, no industrially scalable process had combined high purity, high yield, and a low environmental footprint.

2. The Study at a Glance

Researchers at YMC ChromaCon and Politecnico di Milano purified two therapeutic peptides using eluent systems containing no acetonitrile and no TFA, first as conventional batch processes and then as continuous multi-column counter-current solvent gradient purification (MCSGP) processes. Method development held the column, the 10 CV gradient volume and the 10 g/Lresin loading fixed, so that the batch comparisons isolate the eluent system; the MCSGP processes were then built from those batch methods.

88.1%

Tirzepatide yield at 89.0% purity, using ethanol/acetic acid

6.3

g/Lresin/h productivity, against 5.3 for the ACN/TFA batch benchmark

3.4

Liters of solvent per gram of product — 21% below the conventional batch

93.8%

Tetracosactide yield at 94.0% purity, using dimethyl carbonate/acetic acid

The two model peptides

Tirzepatide

A 39-amino-acid dual GIP/GLP-1 receptor agonist incorporating non-natural residues and a C20 fatty diacid — representative of the structural complexity of next-generation peptide drugs. Purified from 67.5% crude purity using ethanol/acetic acid, against a purity specification of ≥89.0%.

Tetracosactide

A 24-amino-acid analogue of adrenocorticotropic hormone (ACTH), structurally simpler and without lipid conjugation, used clinically to assess adrenal function. Purified from 55.1% crude purity using dimethyl carbonate/acetic acid, against a specification of ≥92.0%.

Both molecules are conventionally purified with ACN and TFA, and both were run against an optimized ACN/TFA batch process as the reference. Together they bracket the range of therapeutic peptides — a heavily engineered modern construct and a long-established sequence — while sharing the same downstream challenges.

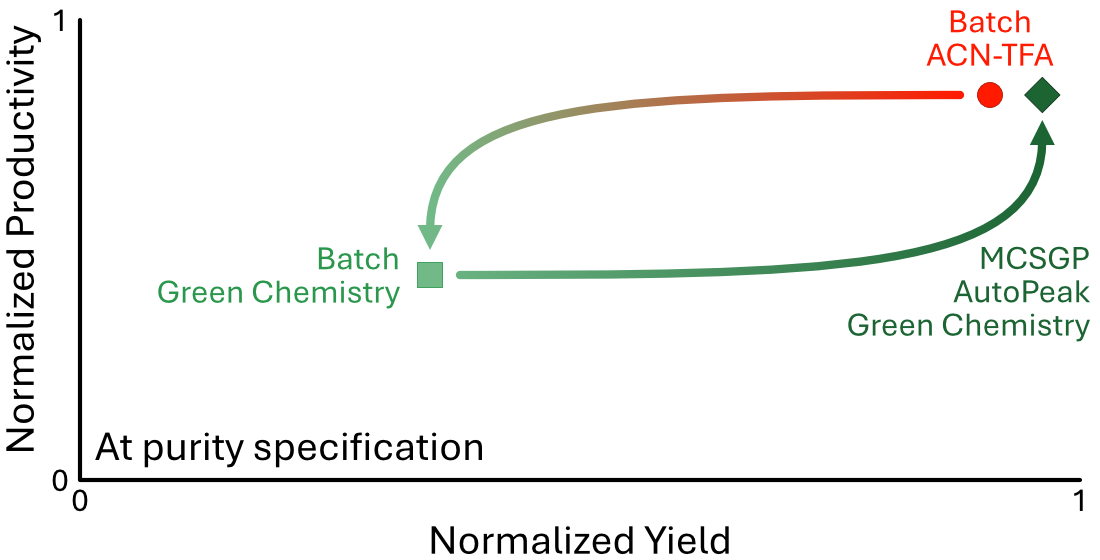
Graphical abstract: green MCSGP moves peptide purification into the high-yield, high-productivity region
Graphical abstract from the original article. Prestia et al., Separations 2026, 13, 195 (CC BY).

3. Where the Yield Goes

The clearest way to understand the result is to look at how the product pool is defined in each of the three processes. The schematic below redraws the Tirzepatide elution profiles reported in the study; the shaded area is the material actually collected.

Batch pool 81.9 % recovered to waste → Batch pool 43.2 % the rest of the peak co-eluteswith impurities → discarded Product collection Strong recycling 88.1 % both regions are recycled onto the next column waste waste UV gradient volume (CV) →
  • Weak recycling
  • Product collection / batch pool
  • Strong recycling
  • Discarded

Acetonitrile with TFA resolves Tirzepatide from its closely related impurities well enough that a wide slice of the peak clears the 89% purity specification, so a single-pass batch run recovers 81.9% of the loaded material. This is the benchmark every green alternative is measured against.

Purity
89.9%
Yield
81.9%
Productivity
5.3 g/Lresin/h
Solvent
4.3 L/g

Schematic representation of the profiles reported in the study, drawn to show how the product pool is defined in each mode. Values are the measured process results; MCSGP figures are averages of cycles 4 and 5 at cyclic steady state. Colors follow the convention used in the article’s figures: blue for weak-side recycling, pink for the collected product pool, green for strong-side recycling. See Figures 1–3 of the original article for the recorded chromatograms.

A Simple Analogy

Picture a sorting line with a single pass. Items that are clearly good go in the keep bin, items that are clearly bad go in the reject bin, and anything ambiguous — good product mixed with something else — has to go somewhere. In a batch process, ambiguous material goes in the reject or reprocess bin — either written off, or set aside for a separate re-sorting job later.

MCSGP adds a return conveyor. The ambiguous fractions go back to the start of the line instead of into the bin, and get sorted again on the next pass. Sharper sorting still helps, but blunter sorting no longer costs product — it costs another trip around the loop.

4. The Green Solvent Penalty, Quantified

Both peptides were first optimized as conventional batch processes using a common gradient-narrowing procedure, so the green and conventional batches are directly comparable. The results reproduce, with numbers, the trade-off that has kept green eluents out of production.

Tirzepatide with ethanol/acetic acid

Under ACN/TFA, the highest purity appeared along the tail of the main peak and a wide collection window satisfied the 89.0% specification, recovering 81.9% at 5.3 g/Lresin/h. Under ethanol/acetic acid the peak took on a double-peak shape, with high purity only at the front and progressive co-elution with closely related impurities after it. The usable window narrowed sharply and yield fell to 43.2%, with productivity down to 2.9 g/Lresin/h.

Tetracosactide with dimethyl carbonate/acetic acid

The ACN/TFA batch produced a sharp product peak with fractions above 95.0% purity and a maximum in-specification yield of 82.8%. The DMC/AcOH batch produced a very narrow collection window followed by a long tail that was high in purity but low in product concentration. The pool consisted of two fractions, giving 92.3% pool purity at 35.3% yield — a 2.3-fold reduction against the conventional batch — and productivity of 1.6 g/Lresin/h.

The study’s own summary of the batch results: batch processing does not allow for high-yielding, productive purification using green eluent systems for the peptides and conditions investigated.

The penalties compound rather than trade off. Lower recovery — and, for Tetracosactide, a longer process time from the added counterion exchange — reduced productivity by a factor of two and three respectively, and solvent consumption moved the wrong way at the same time — roughly doubling for Tirzepatide and rising more than three-fold for Tetracosactide. Reducing the loading density would recover some yield, but at the cost of still lower productivity and still more solvent. In batch operation there is no setting that delivers all three.

5. How MCSGP Closes the Gap

MCSGP — multi-column counter-current solvent gradient purification — is a continuous, twin-column form of gradient chromatography. It does not improve the resolution of the separation. It changes what happens to the fractions that resolution fails to resolve.

The operating principle

  • Two columns, one repeating switch While one column is eluting, the other is being loaded. The roles reverse at each switch, so neither column sits idle and the process runs continuously.
  • The overlap regions are recycled, not discarded The elution is separated into weakly adsorbing impurities, the product fraction, and strongly adsorbing species. The two overlap regions between them — product co-eluting with weak impurities, and product co-eluting with strong impurities — are returned to the loading column instead of being discarded.
  • Inline dilution keeps recycled material on the column For Tetracosactide, a 4.5-fold inline dilution was used to ensure the recycled material re-adsorbed completely on the downstream column. For Tirzepatide, a 4-fold dilution served a second purpose: preventing precipitation or gelation during the collection and recycling phases.
  • The process converges to a cyclic steady state Recycled material accumulates until the internal concentration profile stabilizes. Here that took three cycles; from cycle four onward the chromatograms overlaid almost exactly, and cycles 4 and 5 were used for the performance calculations.

Holding the cut points: UV-based dynamic control

The switch points were set from the live UV signal rather than from elapsed time, using AutoPeak process control. For the Tirzepatide process, a first threshold at 15 mAU opened weak-side recycling, a second at 200 mAU started product collection, and a fall to 75% of the peak maximum — plus a 20-second delay — began strong-side recycling. Because the cut points track the actual peak, the process maintained reproducible cyclic steady-state operation despite variations in the elution profiles.

Batch Chromatography
  • Columns One, operated in sequential steps
  • Side fractions Discarded, or re-chromatographed in a separate campaign
  • Yield vs purity A direct trade-off — a wider pool means lower purity
  • Effect of low resolution Directly reduces yield and productivity
  • Control Fraction collection, typically with offline analysis
MCSGP (Counter-Current)
  • Columns Two, interconnected and switching continuously
  • Side fractions Recycled internally onto the loading column
  • Yield vs purity Largely decoupled — both can be held high
  • Effect of low resolution Absorbed as additional cycle time, not lost product
  • Control Automated UV-triggered switching (AutoPeak)

Applied to the green eluent systems, that mechanism recovered what the batch processes had been discarding. The ethanol/acetic acid MCSGP process reached 88.1% yield at the 89.0% purity specification and 6.3 g/Lresin/h — higher yield and higher productivity than the conventional ACN/TFA batch, using 3.4 L/g of solvent instead of 4.3 L/g. The DMC/AcOH MCSGP process for Tetracosactide, which used weak-side recycling only, reached 93.8% yield at 94.0% purity, exceeding the conventional batch on both.

6. Full Results: Process Comparison

The table below reproduces the study’s process comparison. For the batch processes, the pool with the maximum achievable yield within specification is reported; for MCSGP, the values are averages of steady-state cycles 4 and 5.

Swipe the table sideways to see purity, yield, productivity and solvent use.

Process / eluent system Purity (%) Yield (%) Productivity (g/Lresin/h) Solvent (L/g)
Tirzepatide 39 aa · 67.5% crude · specification ≥89.0%
Batch — ACN/TFA (benchmark) 89.981.95.34.3
Batch — ethanol/acetic acid 90.743.22.97.8
MCSGP — ethanol/acetic acid 89.088.16.33.4
Tetracosactide 24 aa · 55.1% crude · specification ≥92.0%
Batch — ACN/TFA (benchmark) 93.382.84.85.0
Batch — dimethyl carbonate/acetic acid 92.335.31.617.7
MCSGP — dimethyl carbonate/acetic acid 94.093.82.97.9

Source: Table 3, Prestia et al., Separations 2026, 13, 195 (CC BY). Green values improve on the conventional ACN/TFA batch benchmark; red values fall short of it.

Experimental conditions

Columns

YMC-Triart C18-S, 150 × 4.6 mm ID, 10 µm particle size, 12 nm pore size.

Systems

Contichrom CUBE 30, controlled by ChromIQ v9.0 with AutoPeak dynamic process control.

Loading & gradient

10 g/Lresin loading, 10 CV linear gradient, 300 cm/h elution velocity, room temperature.

Tirzepatide eluent

20 mM acetic acid with 1% ethanol (A) to 90% ethanol (B); ACN/TFA reference at 0.1% TFA.

Tetracosactide eluent

20 mM acetic acid with 0.1% DMC (A) to 5% DMC (B), pH 3.2, preceded by counterion exchange.

Process design

Batch chromatograms and fraction analytics imported into MCSGP Wizard v9.0.4.11 to set the operating parameters.

7. What This Means for Peptide Manufacturing

Sustainability and process performance have generally been treated as a trade-off in peptide downstream processing. The practical contribution of this study is to separate them into two independent levers — the eluent chemistry and the operating mode — and to show that the second can pay for the first.

For Tirzepatide, the green continuous process was simply the better process on every measured axis: higher yield, higher productivity, and lower solvent consumption than the conventional batch, while eliminating both TFA and acetonitrile. For that molecule at least, removing a PFAS from the purification step did not have to be traded against process performance. Because eluent consumption is directly associated with the overall waste of the step, and the dilution of the organic solvent prevents recycling, lower consumption means less waste.

The authors also argue that the scalability and operational robustness of MCSGP with AutoPeak support implementation at manufacturing scale, as previously demonstrated for complex biopharmaceutical products such as oligonucleotides, and that the technique has been characterized for process qualification. In that context they identify solvent viscosity and the associated pressure drop as the main additional consideration when using green eluents.

For the wider picture — where MCSGP sits in a peptide purification workflow and what it has delivered at commercial scale — see peptide purification with MCSGP. The regulatory side of the same question is taken up by another study in this series, which works through Process Characterization and Process Performance Qualification on a commercial peptide.

What the study does not claim

  • These are intermediate purity targets, not release specifications. The paper states that the 89.0% and 92.0% values represent intermediate purity targets, and that intermediate chromatographic steps are typically run under less stringent purity requirements. Final therapeutic peptide standards range from 99.0% to 99.9% and are reached across consecutive purification stages.
  • The work is at laboratory scale. Two molecules, 150 × 4.6 mm columns, 10 g/Lresin loading. Scale-up is argued from prior MCSGP experience rather than demonstrated here.
  • Green MCSGP did not win on every metric. For Tetracosactide, productivity remained below the conventional batch and solvent consumption above it, because the acetate-form process includes an 8 CV on-column counterion exchange from TFA to acetate — a step the ACN/TFA route would require downstream in any case, since the drug substance is administered as the acetate salt.
  • The authors have a commercial interest. Four of the five are employees of YMC ChromaCon, which commercializes MCSGP; the paper discloses this, and reports the full batch comparisons so that readers can assess the baseline independently.

8. Key Terms in This Study (Glossary)

Term Definition
AutoPeak UV-based dynamic process control that sets chromatographic cut points from the live detector signal rather than from elapsed time, so switching tracks the actual peak.
Collection window The portion of the elution profile that can be pooled while still meeting the purity specification. A narrower window means lower yield at the same purity.
Counterion exchange Replacing the counterion associated with a peptide — here TFA with acetate — so the ion form is consistent with the eluent system and with the final drug product.
Cyclic steady state The condition in a continuous process where each cycle reproduces the previous one. In this study it was reached after three MCSGP cycles.
Dimethyl carbonate (DMC) A bio-based, low-toxicity organic solvent investigated as a green replacement for acetonitrile in reversed-phase liquid chromatography.
Eluent consumption Liters of mobile phase used per gram of purified product. The paper describes it as directly associated with the overall waste of the purification process.
Green solvent A solvent with reduced hazard to health and environment, preferably renewably sourced and readily biodegradable, as assessed by frameworks such as the CHEM21 guide or the GSK solvent sustainability tool.
Loading density The mass of crude material loaded per liter of resin (g/Lresin). The paper notes that lower loading density would enhance yield, but at the cost of reduced productivity and greater solvent consumption.
MCSGP Multi-column counter-current solvent gradient purification: a continuous twin-column gradient process that recycles partially resolved side fractions between columns instead of discarding them.
Pareto front The set of best achievable combinations of two competing objectives — here yield and purity. A green eluent shifts the whole curve downward relative to ACN/TFA.
PFAS Per- and polyfluoroalkyl substances, a class of highly persistent synthetic chemicals subject to increasing regulatory restriction. TFA belongs to this class.
Process mass intensity (PMI) Total mass of material input per unit mass of product. For peptide solid-phase synthesis it typically ranges from 3,000 to 15,000 kg per kg of active ingredient.
Productivity Mass of product produced per liter of resin per hour (g/Lresin/h). It combines yield, loading, and cycle time into a single throughput measure.
Strong-side recycling Return of the trailing overlap region — product co-eluting with strongly adsorbing impurities — onto the loading column.
Weak-side recycling Return of the leading overlap region — product co-eluting with weakly adsorbing impurities — onto the loading column.
Yield (recovery) The fraction of loaded target material that ends up in the collected product pool, at the stated purity specification.

9. Frequently Asked Questions

Yes. In this study Tirzepatide was purified with ethanol/acetic acid and Tetracosactide with dimethyl carbonate/acetic acid — neither containing acetonitrile or trifluoroacetic acid. Run as conventional batch chromatography, both green systems met their purity specification but lost roughly half the product. Run as continuous MCSGP processes, they reached 88.1% and 93.8% yield respectively, matching or exceeding the ACN/TFA batch benchmark at the same purity specification.

MCSGP — multi-column counter-current solvent gradient purification — is a continuous, twin-column form of gradient chromatography. Instead of discarding the side fractions in which product overlaps with impurities, it returns them to the second column while that column is being loaded. The pure center of the peak goes to the product pool; the impure shoulders receive another pass. This decouples yield from purity, which are inherently in tension in single-column batch operation.

Trifluoroacetic acid is a per- and polyfluoroalkyl substance (PFAS) and is highly persistent in the environment, which places it in the path of tightening regulation. Acetonitrile, its usual partner in reversed-phase peptide purification, is flammable and toxic. Both are used in large volumes: preparative peptide chromatography can consume hundreds to thousands of liters of eluent per kilogram of purified peptide, of which 10–40% is organic modifier.

Approximately half, in this study. At a fixed purity specification, Tirzepatide yield fell from 81.9% with ACN/TFA to 43.2% with ethanol/acetic acid, and Tetracosactide yield fell from 82.8% to 35.3% with dimethyl carbonate/acetic acid. Productivity dropped by factors of two and three respectively. Importantly, the purity target was met in every case — the limitation was the width of the collection window, not the achievable purity.

It depends on the molecule. For Tirzepatide, MCSGP with ethanol/acetic acid used 3.4 L/g against 4.3 L/g for the ACN/TFA batch — roughly 21% less, with neither acetonitrile nor TFA. For Tetracosactide it used 7.9 L/g against 5.0 L/g, because that process integrates an on-column counterion exchange from TFA to acetate. That exchange would be required downstream of the conventional route in any case, since the drug substance is administered as the acetate salt.

The study treats it as a design consideration rather than a barrier. Its conclusions state that using green eluents mainly requires consideration of solvent viscosity and the associated pressure drop, and identifies this as the principal additional factor when scaling green MCSGP. Ethanol is more viscous than acetonitrile.

Two, selected for contrasting structural complexity:

  • Tirzepatide — a 39-amino-acid dual GIP/GLP-1 receptor agonist with non-natural residues and a C20 fatty diacid, purified from 67.5% crude purity.
  • Tetracosactide — a 24-amino-acid ACTH analogue without unusual modifications, purified from 55.1% crude purity.

Both were run on 150 × 4.6 mm YMC-Triart C18-S columns at 10 g/Lresin loading, on Contichrom CUBE 30 systems. The MCSGP runs used UV-triggered AutoPeak process control.

Yes. It is published open access under a CC BY license in Separations (MDPI), so it can be read, downloaded, and reused with citation. Complete method tables for all four processes, the MCSGP scheduling charts, and the cycle-by-cycle steady-state data are provided in the supplementary material.

ChromaCon AG
Technoparkstrasse 1
8005 Zürich, Switzerland
+41 (0)44 445 20 10
ISO 9001:2015 certified quality management
English | Deutsch
  • Applications Overview
  • Antibody-drug Conjugates
  • Impurity Isolation
  • mAbs & Antibody Variants
  • Small Molecules & Nutraceuticals
  • Oligonucleotides
  • Peptides
  • Recombinant Proteins
  • Viral Vectors (AAV)
  • Systems Overview
  • Contichrom® CUBE
  • Contichrom® PILOT
  • Contichrom® TWIN HPLC
  • Contichrom® TWIN LPLC – Capture
  • Contichrom® TWIN LPLC – Polishing
  • Technologies Overview
  • Batch Chromatography
  • Continuous Capture (CaptureSMB®)
  • Continuous Enrichment (N-Rich®)
  • Continuous Polishing (MCSGP)
  • Dynamic Process Control (AutoPeak® & AutomAb®)
  • Multi-Dimensional Chromatography (2D/3D)
  • Services Overview
  • Custom Purification
  • Demos & Introductions
  • Feasibility Studies
  • Maintenance & Repair
  • Process Modeling
  • System Rentals
  • Training & Consulting
  • About ChromaCon
  • News & Events
  • Distributors
  • Careers
  • Contact
  • Resource Library
  • Educational Articles
© 2026 ChromaCon, A YMC Company. All rights reserved. ChromaCon is a proud member of the YMC Group. | YMC ChromaCon is a business unit of YMC Co., Ltd.
  • AI Image Use
  • Imprint
  • Privacy Policy
  • Cookie Policy
  • Terms and conditions
  • Chromatography Solutions
    By Application By System By Service
    Peptides Oligonucleotides mAbs & Antibody Variants Antibody-drug Conjugates Recombinant Proteins Viral Vectors (AAV) Small Molecules & Nutraceuticals Impurity Isolation
    Contichrom® CUBE
    CUBE 30 (36 mL/min) CUBE 100 (100 mL/min) CUBE Software CUBE Accessories
    Contichrom® PILOT
    PILOT 300X (300 mL/min)
    Contichrom® TWIN HPLC
    TWIN 300 (3.3 L/min) TWIN 500 (8.3 L/min) TWIN 1000 (18.9 L/min) TWIN 2000 (36 L/min)
    Contichrom® TWIN LPLC - Capture
    TWIN 300 (3.3 L/min) TWIN 500 (8.3 L/min) TWIN 1000 (18.9 L/min) TWIN 2000 (36 L/min)
    Contichrom® TWIN LPLC - Polishing
    TWIN 300 (3.3 L/min) TWIN 500 (8.3 L/min) TWIN 1000 (18.9 L/min) TWIN 2000 (36 L/min)
    Demos & Introductions Training & Consulting System Rentals Process Modeling Feasibility Studies Custom Purification Maintenance & Repair
    By Application
    Peptides Oligonucleotides mAbs & Antibody Variants Antibody-drug Conjugates Recombinant Proteins Viral Vectors (AAV) Small Molecules & Nutraceuticals Impurity Isolation
    By System
    Contichrom® CUBE
    CUBE 30 (36 mL/min) CUBE 100 (100 mL/min) CUBE Software CUBE Accessories
    Contichrom® PILOT
    PILOT 300X (300 mL/min)
    Contichrom® TWIN HPLC
    TWIN 300 (3.3 L/min) TWIN 500 (8.3 L/min) TWIN 1000 (18.9 L/min) TWIN 2000 (36 L/min)
    Contichrom® TWIN LPLC - Capture
    TWIN 300 (3.3 L/min) TWIN 500 (8.3 L/min) TWIN 1000 (18.9 L/min) TWIN 2000 (36 L/min)
    Contichrom® TWIN LPLC - Polishing
    TWIN 300 (3.3 L/min) TWIN 500 (8.3 L/min) TWIN 1000 (18.9 L/min) TWIN 2000 (36 L/min)
    By Service
    Demos & Introductions Training & Consulting System Rentals Process Modeling Feasibility Studies Custom Purification Maintenance & Repair
  • Learning Center
    Technologies Resource Library Research Highlights Educational Articles
    Batch Chromatography Multi-Dimensional Chromatography (2D/3D) Continuous Capture (CaptureSMB®) Continuous Polishing (MCSGP) Continuous Enrichment (N-Rich®) Dynamic Process Control (AutoPeak® & AutomAb®)
    Application Notes Webinars & Videos Process Guides & Manuals Peer-Reviewed Publications Brochures & Datasheets White Papers
    Peptide Purification Oligonucleotide Purification
    Fundamentals of Preparative Chromatography Troubleshooting & Best Practices (Coming Soon)
    Technologies
    Batch Chromatography Multi-Dimensional Chromatography (2D/3D) Continuous Capture (CaptureSMB®) Continuous Polishing (MCSGP) Continuous Enrichment (N-Rich®) Dynamic Process Control (AutoPeak® & AutomAb®)
    Resource Library
    Application Notes Webinars & Videos Process Guides & Manuals Peer-Reviewed Publications Brochures & Datasheets White Papers
    Research Highlights
    Peptide Purification Oligonucleotide Purification
    Educational Articles
    Fundamentals of Preparative Chromatography Troubleshooting & Best Practices (Coming Soon)
  • About Us
    • About ChromaCon
    • News & Events
    • Distributors
    • Join our team
    • Contact
Get in Touch
English | Deutsch
Manage Consent

To provide the best experiences, we use technologies like cookies to store and/or access device information. Consenting to these technologies will allow us to process data such as browsing behavior or unique IDs on this site. Not consenting or withdrawing consent, may adversely affect certain features and functions.

Functional Always active
The technical storage or access is strictly necessary for the legitimate purpose of enabling the use of a specific service explicitly requested by the subscriber or user, or for the sole purpose of carrying out the transmission of a communication over an electronic communications network.
Preferences
The technical storage or access is necessary for the legitimate purpose of storing preferences that are not requested by the subscriber or user.
Statistics
The technical storage or access that is used exclusively for statistical purposes. The technical storage or access that is used exclusively for anonymous statistical purposes. Without a subpoena, voluntary compliance on the part of your Internet Service Provider, or additional records from a third party, information stored or retrieved for this purpose alone cannot usually be used to identify you.
Marketing
The technical storage or access is required to create user profiles to send advertising, or to track the user on a website or across several websites for similar marketing purposes.
  • Manage options
  • Manage services
  • Manage {vendor_count} vendors
  • Read more about these purposes
View preferences
  • {title}
  • {title}
  • {title}